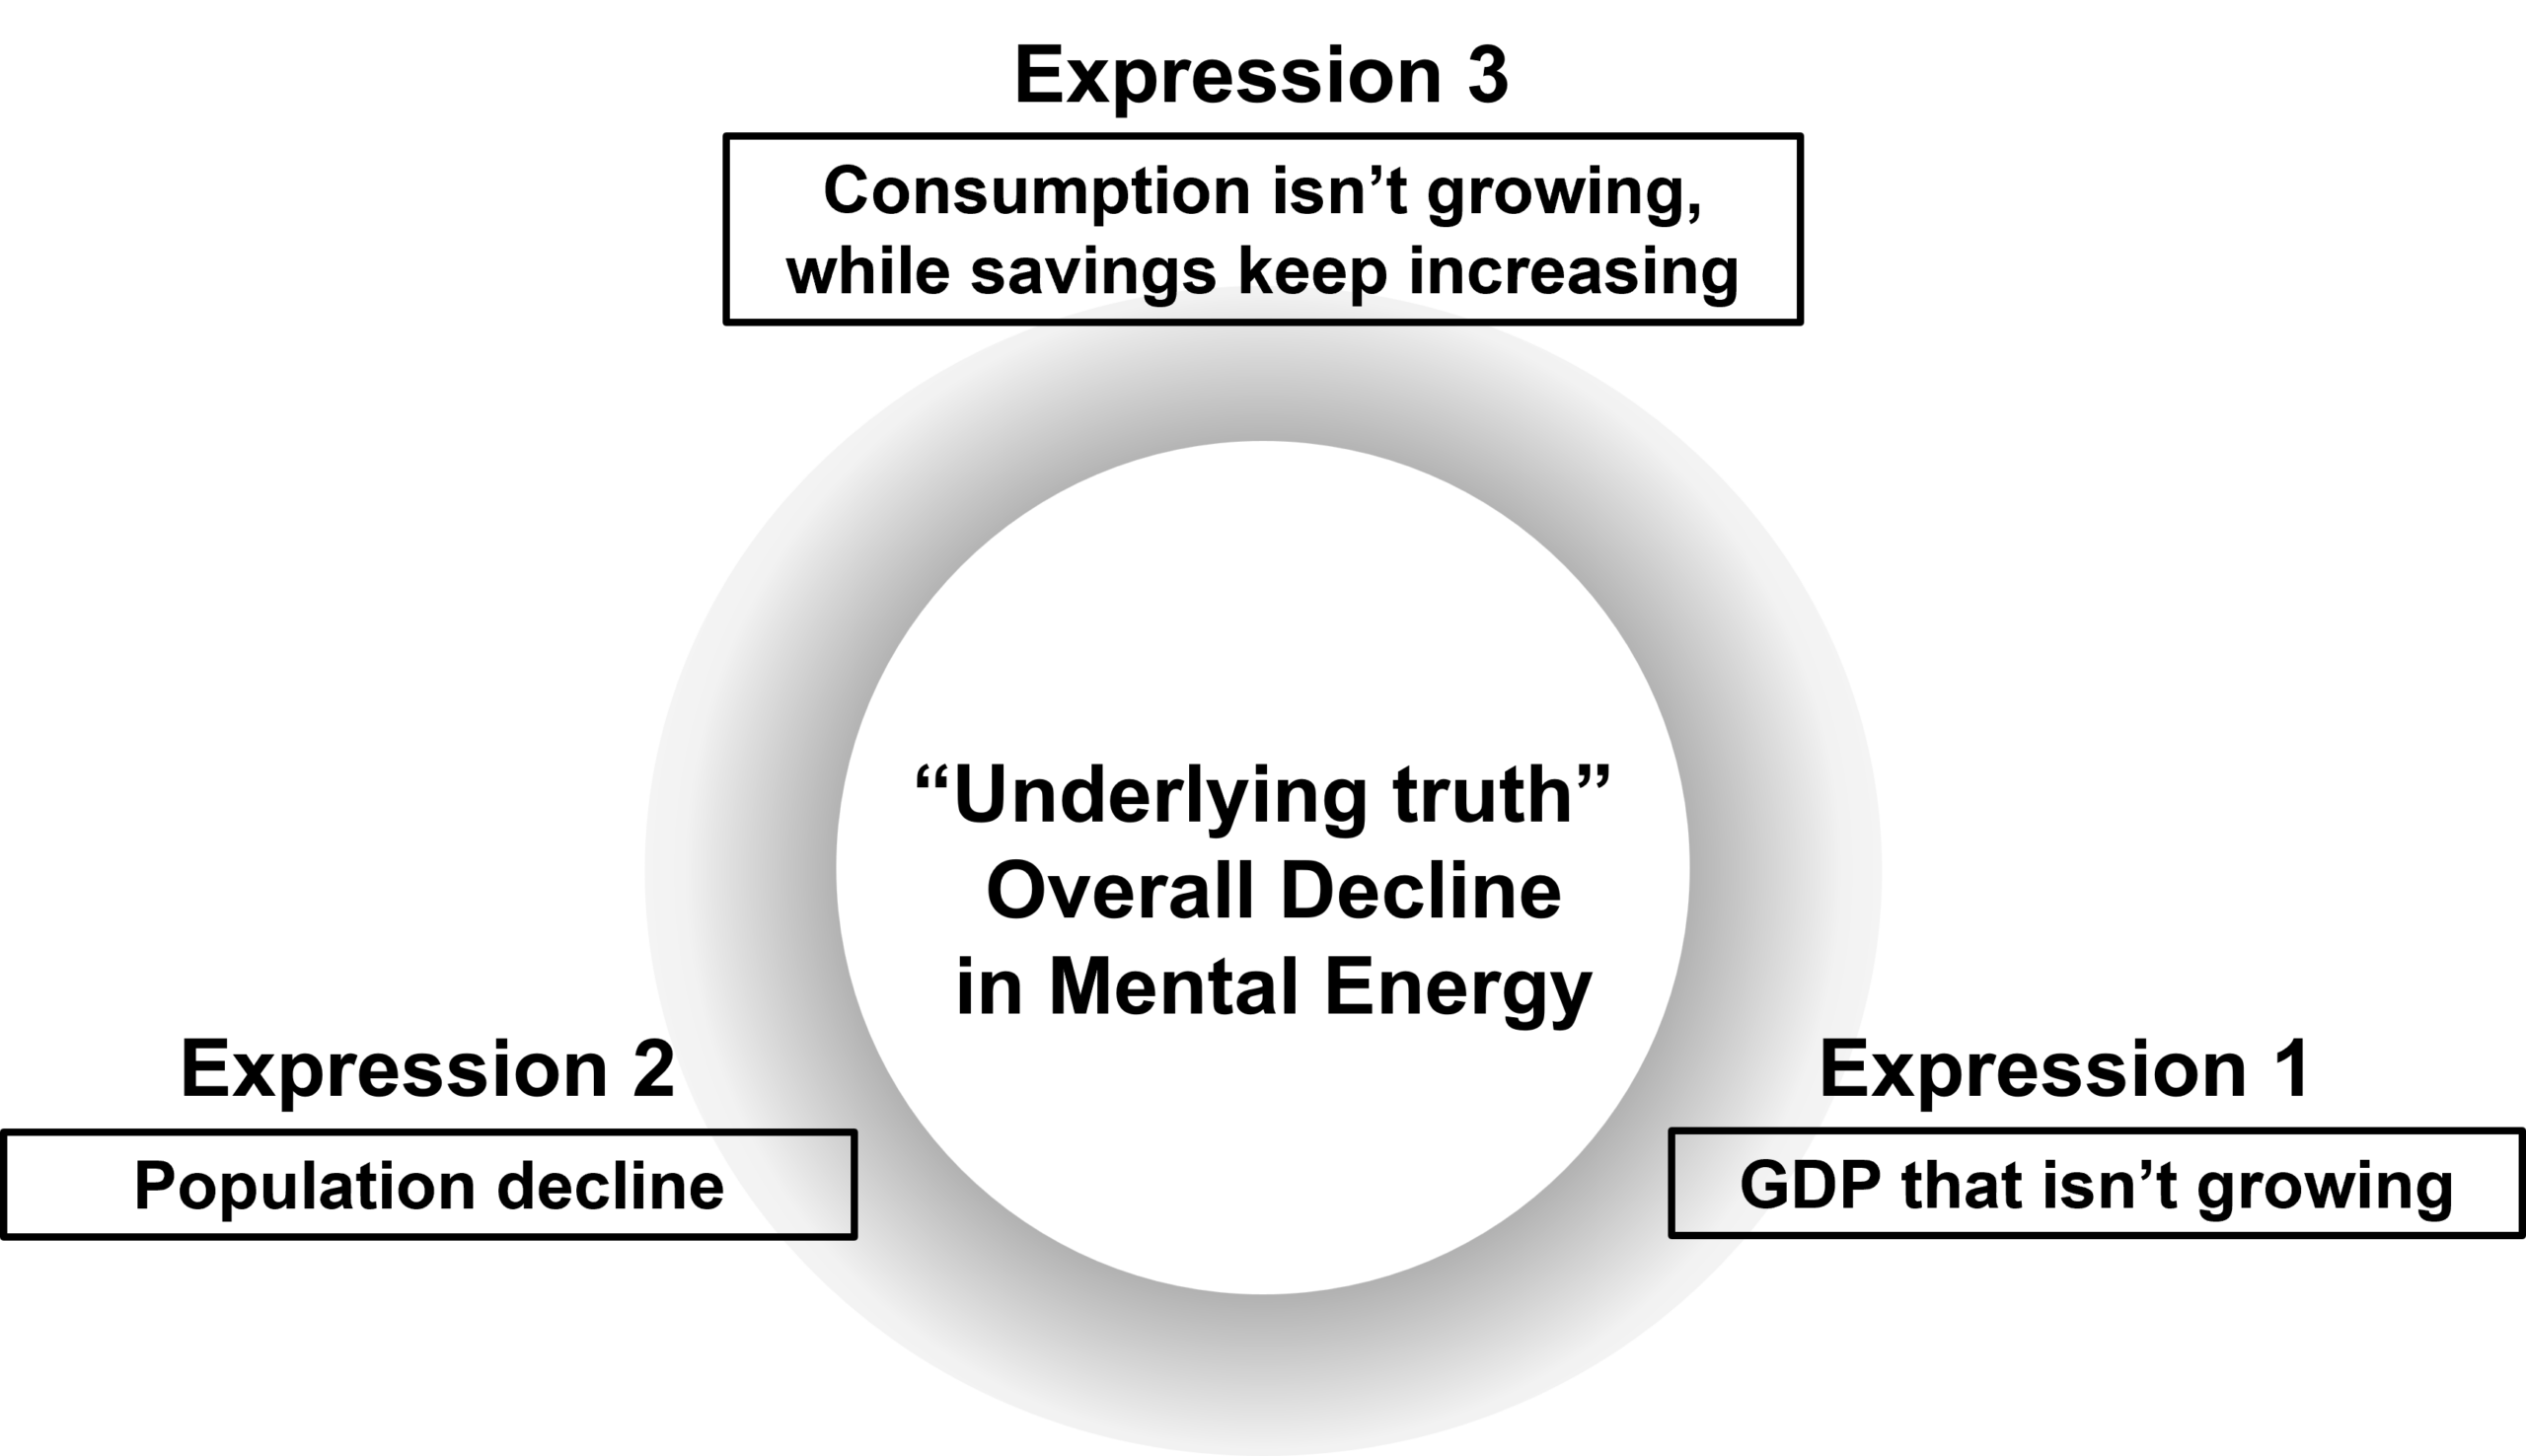
As a fundamental principle underlying the three selected social phenomena, I assume a decrease in the total energy of the human mind.
If this decrease were reversed, the social phenomena that appear as its expression would also be expected to reverse. Here, I examine data on the three social phenomena and consider, in comparison with thermodynamics, what kinds of qualitative differences give rise to them.
First, I take GDP as one example of a social phenomenon and examine it in connection with the hypothesis of mental energy.
There are many different sets of GDP statistics, reflecting different time periods and methods of calculation.
Figure 3-2 presents one example organized according to specific features. When we look at data that distinguish emerging economies, their GDP shows growth above the world average. Developed countries other than Japan, as well as the world average, are also growing. In contrast, only Japan has experienced stagnation for about 30 years. This fact suggests that there is some meaningful difference between Japan and the rest of the world.
Table 3-2 presents the latest global GDP ranking based on data released by the International Monetary Fund.
As a result of prolonged stagnation, Japan has been overtaken by China, Germany, and India, and is barely maintaining fifth place. Before long, it is likely to be surpassed by the United Kingdom as well, falling to sixth place.
There must be something behind this trend. It may reflect a psychological and social reality unique to Japan, and could be seen as an expression of declining mental energy. In other words, it suggests that certain differences have narrowed, creating a situation in which energy is less likely to emerge.
What, then, distinguishes Japan from the rest of the world?
One factor that immediately comes to mind is the presence of foreign residents and immigrants. Compared with Europe and the United States, Japan has a strikingly low proportion of immigrants, with foreign nationals making up only about 3% of the population. In contrast, countries such as Germany, France, the United Kingdom, and the United States are societies strongly shaped by immigration, and the tensions and challenges that accompany it are often reported in the media.
For many years, we have naturally watched scenes at the Olympics in which athletes from diverse racial backgrounds compete as members of the United States team.
In societies where the proportion of foreign residents exceeds 10 percent, cultural and racial differences can generate a certain kind of energy. In the United States, where gaps in wealth and differences between business success and failure are large, the population continues to grow despite being a mature economy, and the issue of a declining birthrate and aging population does not dominate public discussion. Emerging economies also show strong GDP growth, and similarly, the problem of a declining birthrate and aging population is not a central issue.
In general, poorer countries tend to have higher birthrates. In Japan, there has long been a saying that poorer families tend to have more children. Immigration is not the only factor. In a large country such as China, there are significant income gaps between urban and rural areas. If we assume that such differences generate mental energy, this helps explain China’s GDP growth.
Contact between those who succeed and those who do not within a society can create psychological energy such as envy and motivation. That energy, including the conflicts it may bring, can become a source of social vitality.
Describing a Society in Which Energy Release Has Decreased (2)
Vol.19-24
Mar 17, 2026
Content of This Article
Describing a Society in Which Energy Release Has Decreased (2)
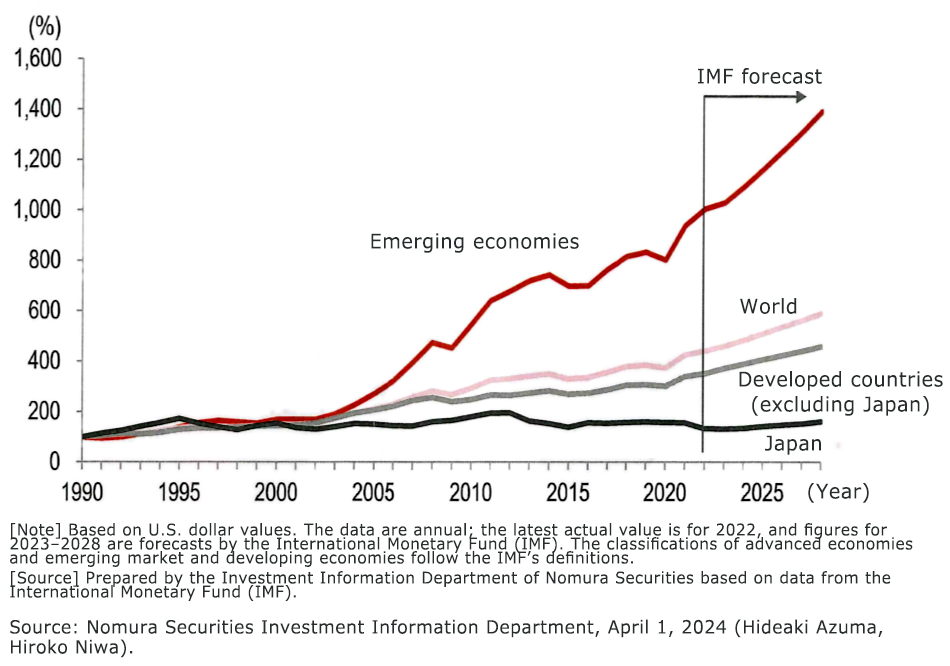
Figure 3-2: Trends in World Nominal GDP (Indexed to 100 in 1990)
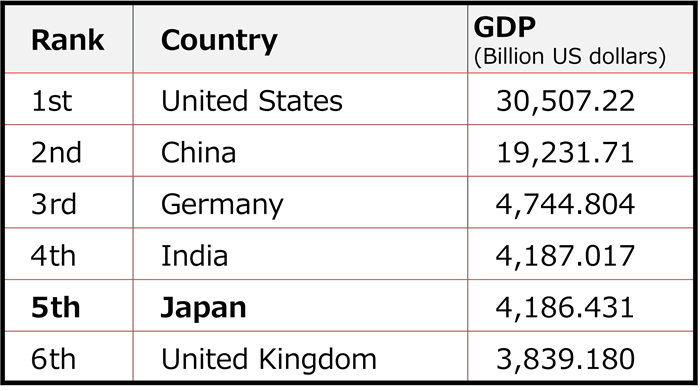
Table 3-2: 2025 World GDP Ranking (Based on IMF Data)
Japan, once ranked second, has been overtaken by China, Germany, and India and has fallen to fifth place.
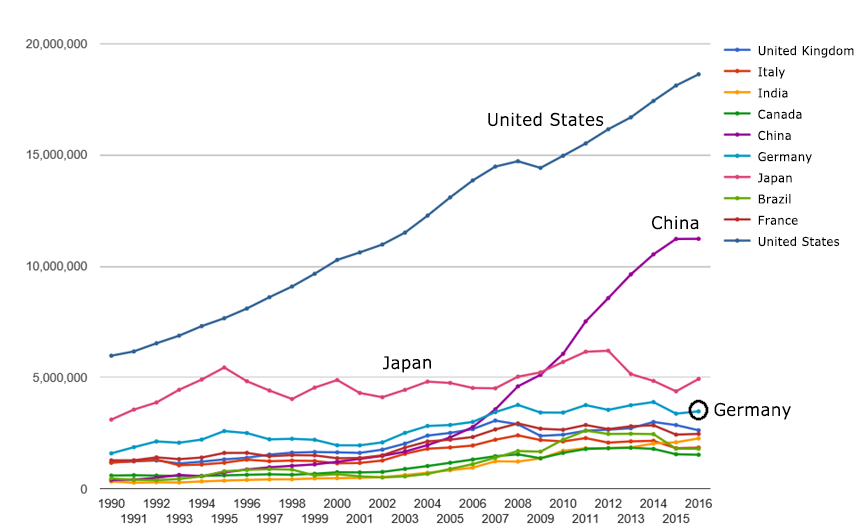
Figure 3-3: Relative GDP Growth of Major Countries (Source: GLOBAL NOTE; based on IMF data)
Until 1995, Japan had grown faster than other countries and ranked second in the world, approaching the United States.
At that time, the phrase “Japan as Number One” was widely used to describe its position.
Japan once experienced a period when it was described as “Japan as Number One. ”
Figure 3-3 presents GDP data for major countries to show Japan’s position at that time. Japan had grown to become the world’s second-largest economy, approaching the scale of the United States. It is reasonable to think that behind this achievement—reached by a nation devastated by defeat in World War II—was the strong mental energy of the people who led the postwar reconstruction.
After World War II, American music flowed into Japan, food was imported, and school lunches included bread and powdered milk. The population increased, and the baby boom generation born between 1947 and 1949 formed a peak in the population.
The coexistence of poverty and rapid population growth was something people could feel directly in their daily lives. During this time, there seemed to be a strong desire for prosperity among the people. For me, born in 1950, even a bicycle appeared to be a valuable possession. I still remember my father looking with admiration at our neighbor’s 125cc motorcycle. It was an era when aspiration was widely shared in society. A boiled egg or a banana eaten at a school sports day was a special treat enjoyed only once a year. By the time I was in junior high school, the idea of attending a university—then seen as a special place of higher learning—began to feel like a real possibility.
Teachers appeared to be respected figures who had graduated from university. Out of a class of 63 students, only about ten went on to high school, and it was common for most to enter the workforce. Going to university became a turning point in life and a source of aspiration, generating mental energy in the form of ambition and competitiveness.
In other words, the period of strong GDP growth overlapped with a time when clear differences existed within society, were widely recognized, and were accompanied by aspiration.
What explains the difference between the period of economic growth that lasted from the end of the war until around 1995 and the roughly 30 years of stagnation that followed? Many discussions have addressed this question. A clear illustration can be seen in Figure 3-4, which shows changes in growth rates.
The data presented here cover the years from 1995 to 2015, but since little growth has been observed after 2015, it can be said that Japan’s stagnation has continued for nearly three decades. Countries with the highest growth rates include Qatar, Vietnam, China, and India. Japan ranks at the bottom as the only country with negative growth, followed by Germany, Greece, France, and Italy.
If we adopt the hypothesis that developing countries grow faster than mature economies because of the presence of mental energy such as aspiration and ambition, then Japan’s negative growth suggests that psychological factors may be hindering its development.
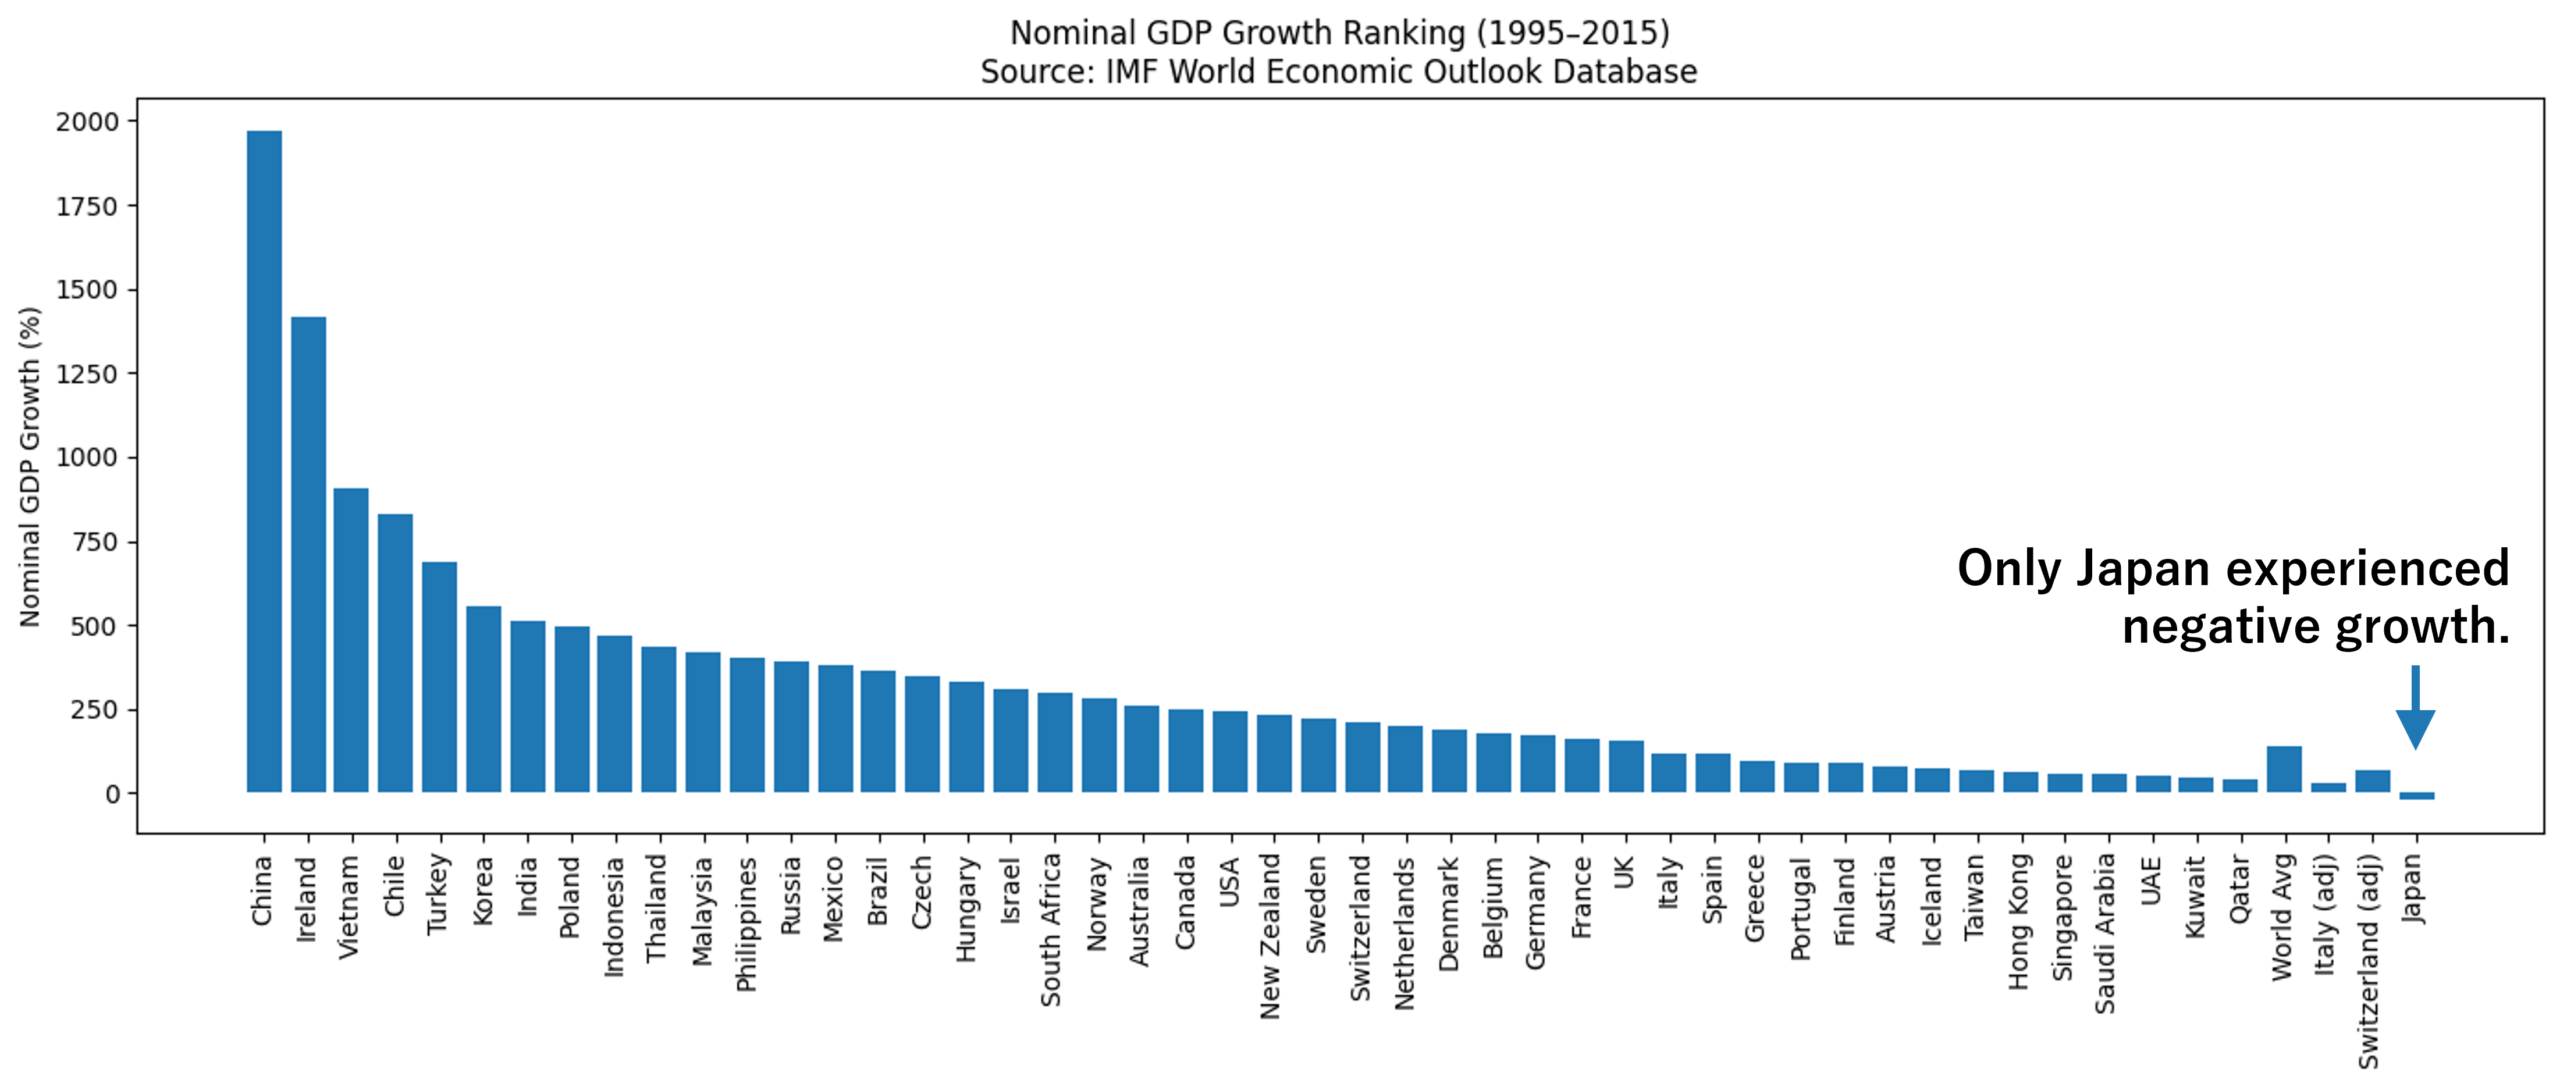
Figure 3-4: GDP Growth Rates by Country
Japan is the only country with a negative GDP growth rate, making it the sole economy in decline.
Over the past 20 years, Japan’s economic policies have been the worst among the countries compared.
There are attempts to explain the factors that hinder growth by using economic indicators. An indicator is a clue that represents an underlying reality that cannot be measured directly but is correlated with it.
As analysis proceeds, many different indicators are identified, and it is natural that they are interconnected. However, these related indicators are often organized as if they stand in a clear cause-and-effect relationship.
As discussed in Chapter 1, different expressions of reality may take different forms, yet they point to the same underlying value and can therefore be related to one another. When indicators are arranged in chronological order, they can appear as cause and effect. In explaining GDP as well, understanding is often sought by linking various indicators together.
In recent years, the depreciation of the yen has often been cited as the reason Japan’s per capita GDP has been caught up by Taiwan and South Korea. Yet the weaker yen is only one indicator. It is also explained that Japan’s relative position has declined because companies, importing raw materials and seeking to avoid tariffs or secure profits, have shifted production bases overseas to places such as China.
However, the weaker yen and the decline in relative standing are merely different indicators expressing the same underlying reality. They do not reach the deeper source that gives rise to them.
Similarly, Japan’s low growth rate is sometimes presented as the cause of its being overtaken. That lower growth rate is then attributed to a decline in the labor force, which in turn is linked to the progress of population aging.
However, population aging and a slowing growth rate of the labor force are simply different indicators describing the same underlying reality. They do not explain the deeper cause that produces them.
Although Japan’s growth rate is lower than South Korea’s, South Korea has an even lower birthrate and a declining labor force. Yet its higher growth rate is often explained by faster technological progress and a more advanced industrial structure. This, too, remains an explanation that links different kinds of indicators—changes in the pace of technological development and shifts in industrial structure—in a rational way. It does not address the essential underlying energy behind these realities. Even so, using changing indicators from abroad can still help describe the phenomenon of Japan’s lack of growth, even if it does not fully explain its root cause.
There are data showing that Japan’s industrial structure has changed very little.
Figure 3-5 presents the distribution of research fields among researchers in Japanese companies. It shows that over the past 20 years, researchers have continued to work in almost the same fields. If the distribution of specialties remains unchanged, this suggests that the industrial structure companies aim for in order to generate profits has also remained largely the same.
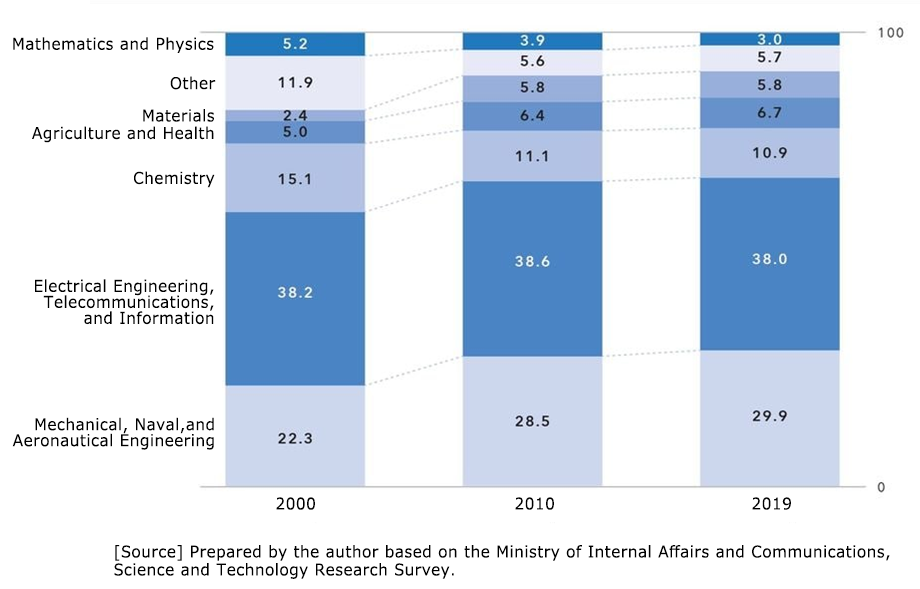
Figure 3-5: Distribution of Research Fields among Researchers in Japanese Companies
Reprinted from *Toyo Keizai Online*: “The True Cause of Why Innovation Has Ceased to Emerge in Japan”
Go to the original page (Toyo Keizai Online Website) *written in Japanese
Even so, in recent years there have been examples that suggest change. One of them is the widespread use of smart phones.
I myself believed that a conventional mobile phone was sufficient for my needs and continued using one for many years. However, three years ago, I finally switched to a smartphone. The reason was the high cost of international calls.
After switching, my usage gradually changed, but I do not play games or use it for online shopping, so I have not strongly felt the benefits of its convenience. I also continue to prefer paying with cash. However, when I look around, I see that even people in the older age group are increasingly using smartphones.
Over the past few years, I have sensed signs that older generations are gradually moving into the digital environment.
The fact that we are only now beginning to feel such changes suggests, conversely, that Japan’s living environment did not change dramatically over the past 30 years. If we view this situation from the perspective of Japan’s spiritual and cultural background, it may indicate a tendency within Japanese society to resist change.
A culture seems to have taken root that values a life with fewer differences—one that is uniform, relatively equal, and open only to gradual change. It appears that a kind of generational inertia, a mental energy that seeks to preserve this stability, has been at work.
When we observe the use of identical school uniforms, similar lifestyles, and social systems with relatively small gaps in wealth and status, we can see a living environment supported by a limited degree of difference.
In the past, mergers and acquisitions or the appointment of foreign CEOs were rare. In earlier times, when Japanese companies had little involvement with foreign firms, the pay gap between executives and ordinary employees was only about three to four times. This also reflects the traditional corporate culture of Japan. It suggests that a social environment with relatively small differences functioned as a kind of mental inertia.
Today, however, gradual changes are beginning to appear. Japan may also be entering a period in which clearer differences emerge.
In the next section, I will consider a second social phenomenon: population decline.
[ Author : Y. F. ]